
More than Metrics
Why you sometimes feel like just a number


Towards the end of a first date, there is only one question that matters: will there be a second date? Your date has stepped away from the table for a minute, so you think back through dinner. You believe it went well; they seemed engaged in the conversation and genuinely interested in what you had to say, but it’s hard to know for sure. It would be great to have some data to back up your hunches.
Thankfully, you’ve subscribed to that new date evaluator app, so your phone has been capturing data for you. You open the app to check the values:
Your phone use: 20 minutes
Laughs from your date: 5
Your date’s sincere questions: 7
Overall engagement: 7/10
Great numbers! You’re already planning your second date while you wait for your date to return. Your phone goes back into your pocket, still tracking, of course. When they return, you have dessert and ask about a second date. After a polite “no,” you are surprised and trying to figure out what happened. What went wrong? You double-check your final tally and decide you’re going to have to shoot for better results next time. You can’t turn your phone off or you’ll lose tracking, but maybe you could put it in a bag under the table to reduce your phone use. You also decide to prepare more interesting and funnier stories with ChatGPT to get more laughs and more sincere questions. If you can improve all three numbers, then a second date has to come next time!
While (hopefully) apps like this remain fiction, the story illustrates both the power and pitfalls that real-time tracking has introduced for creators of websites and apps. Having data or metrics is a critical part of understanding how well a product is working. It quantifies how easy or difficult it is to complete key flows in an app and shows how those flows are improving over time. This is how successful products measure and remove friction in the lives of their users. But all this data also provides a temptation: to simply see people as numbers on a screen. Companies that fall into that temptation do the same thing as the person on the date: they try to improve the things they can measure but don’t actually improve the experience of their customers. Often, they make it worse, like the person’s next date having to listen to multiple “funny” stories generated by ChatGPT. The best apps and companies actually know the people they serve through hours of conversation and time spent with them. They optimize their app to help their users achieve their goals, not to make numbers go up.
So what does this look like in practice? Imagine that you are a sports editor at the New York Times in 1995. Your job is to make sure that writers create quality articles on topics that people in New York want to read about. What are the stories that are going to get someone to buy a paper from the newsstand? What are people looking for that will convince them a subscription is worth it? In 1995, those questions are difficult to answer. Readers write letters and emails in response to stories, but not enough to make clear judgments. Do people want to hear more about the Knicks or the Yankees?

Even when the Times moved their stories to their website in 1996, those questions were not answered immediately. It took another product to do that, a product you may not even be aware of but is so ubiquitous that it is present on 60% of the websites you visit1. That product is Google Analytics.
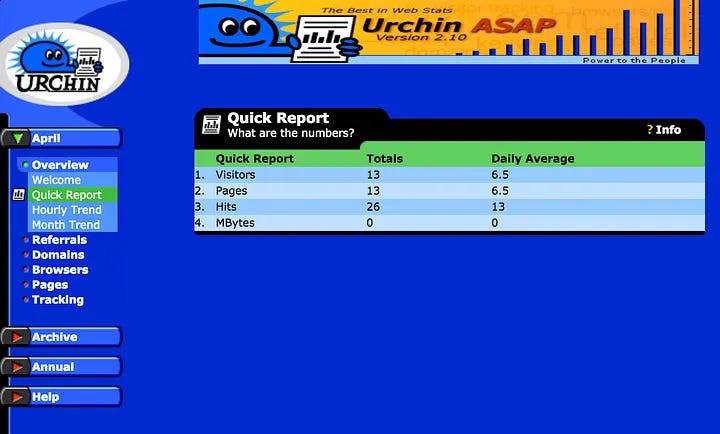
Google Analytics started out the way many successful products do: a side project that solved a problem for the company’s core business2. In 1995, the company that created Google Analytics started out as a web hosting company to take advantage of the dot-com boom. They spent most of their money on a server and bandwidth, so it was important for them to understand how much bandwidth was used by which clients. This led to the creation of Urchin, a tracking software based on the web server logs. Initially, it showed “hits” (web page views) and “referrers” (which other website the user came from). This information was helpful for tracking bandwidth, but they soon found it was also useful to their customers.
Even with basic page view tracking, you can start to see how this could start to transform how our sports editor at the Times thinks about stories. Instead of relying on letters or emails from readers, the editor can see hard numbers on how many people viewed each story online. Now the question of Knicks versus Yankees has a clear, numeric answer: Knicks stories have four times more page views than Yankees stories.
Eventually, the folks working on Urchin decided to focus all their attention on that product, renaming the company after it and starting to sell it to large web hosting platforms and Fortune 500 companies. They focused on log processing speed in order to handle large amounts of traffic. Large sites didn’t want to be held back by delays in traffic data, and Urchin solved that problem for them. Now our sports editor can instantly see how many people have viewed the page for each story.
Page views are an example of what is typically called a “metric,” a numeric indicator of performance for a website or app. Page views were one of the earliest web metrics because, at the time, it was one of the only options. The web servers logged which pages were requested by users, but once the user loaded the page there was no further information. With improvements in web technology, Urchin saw that collecting data about what a user did after they loaded the page was becoming possible. They were one of the first in the market to combine tracking of actions the user took on the page with the server logs they already had. When new cookie technology allowed them to tie actions to specific users across time, new and more powerful metrics became possible.
So how did this help our sports editor? Previously, they could only see which stories were clicked on, but now they could see which stories were actually read. Metrics like “session time” (the amount of time someone spends on a page) and “scroll depth” (how far down a page the user scrolled) could be used to measure reader engagement. Now the editor could see which stories a user opened but didn’t read (“bounce rate”) and compare those to the ones they actually read. It turns out people click on stories about the Knicks but actually read stories about the Yankees.
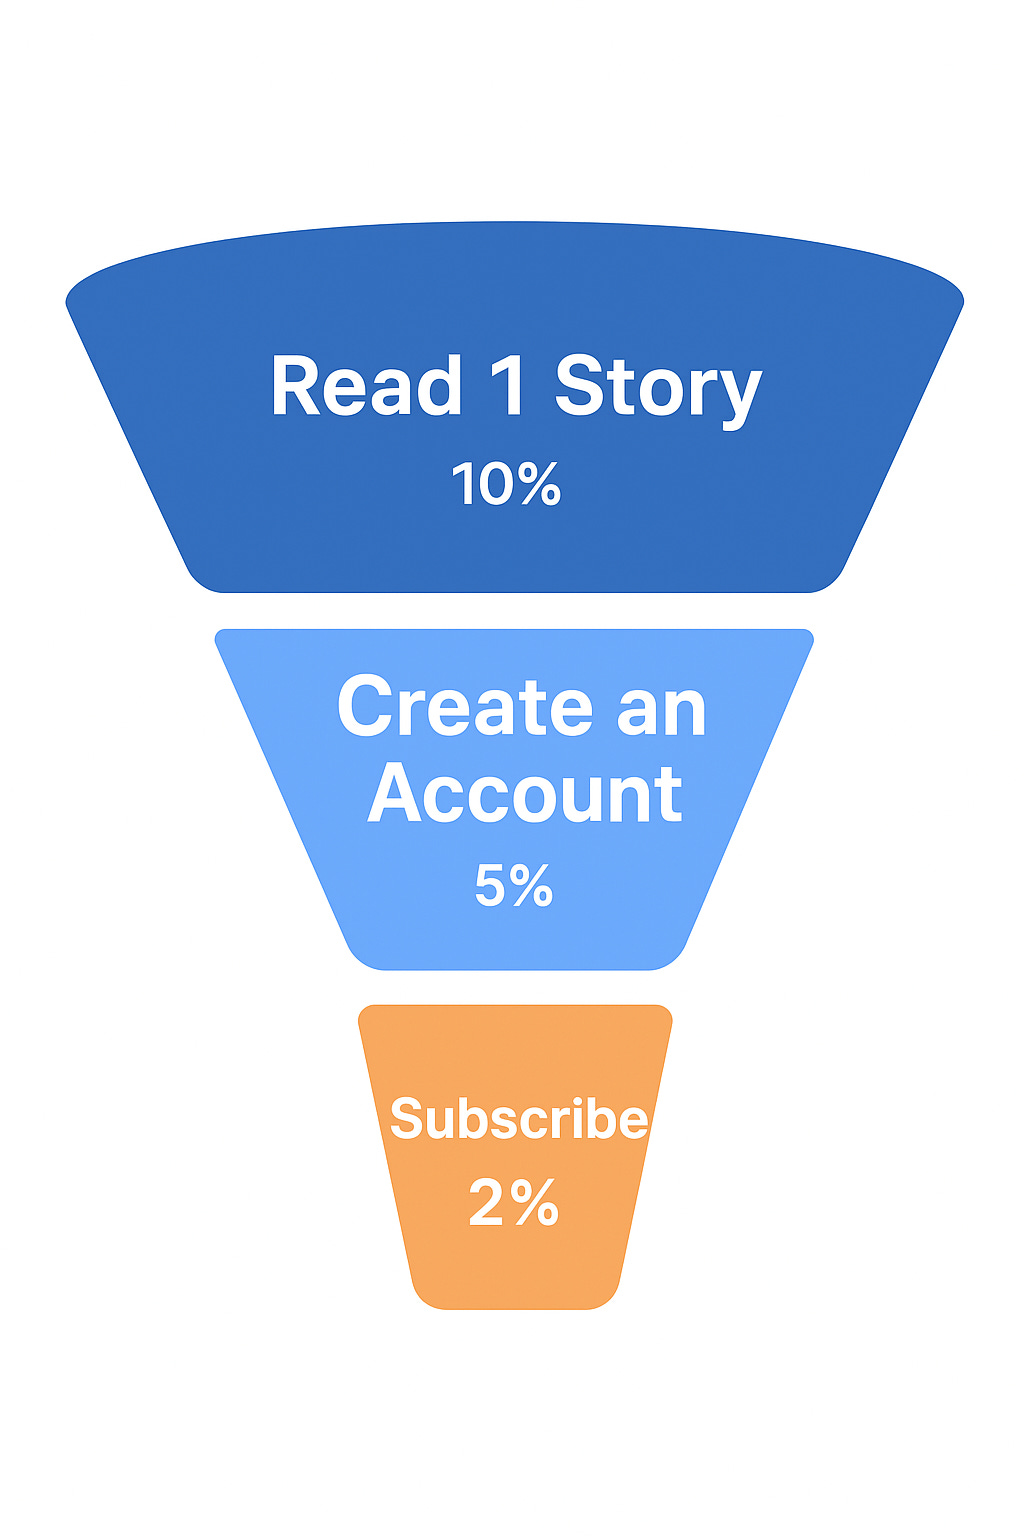
This also enabled him to answer the ultimate question: what stories get people to subscribe? The advanced tracking introduced by Urchin enabled accurate tracking of “funnels” (a series of steps to complete a goal) and “conversions” (completions of that goal). So for readers of the Times, a funnel might look like this, with subscribe being the ultimate conversion:
With these types of metrics in place, an editor can see which stories are read by people who eventually choose to subscribe. He can even assign a monetary value to each story based on the subscriptions it helps drive. Now our editor can quantify which stories and writers make the most money or show how subscriber revenue from the sports section is higher than other sections in order to advocate for more budget or a raise.
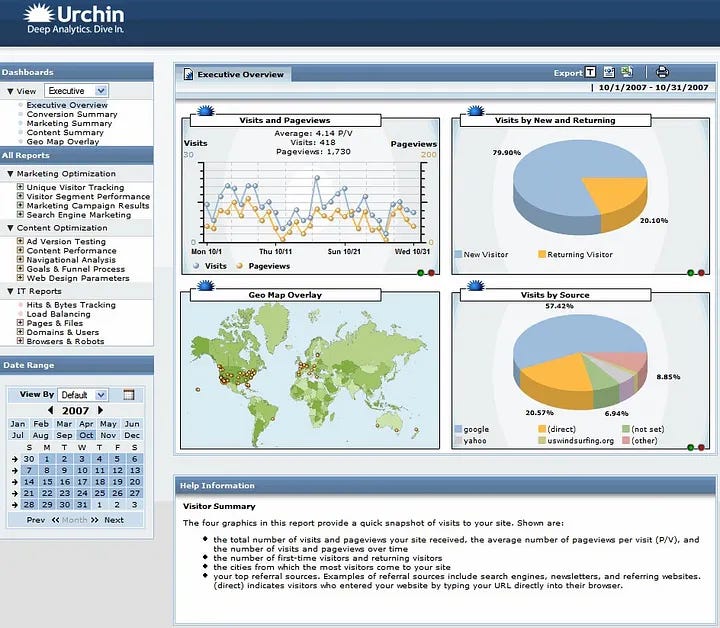
Enabling these metrics and funnels solved key knowledge gaps for Urchin’s customers and drove their growth in the market. By 2004, they had the attention of Google, who saw the power of this kind of tracking when combined with search ads. Connecting key conversions like purchases directly to a click on a search ad would be a powerful selling tool for its ad platform. So Google acquired Urchin in 2005 and relaunched the product as Google Analytics, integrated with Google Ads. In typical Google fashion, they released it with a generous free tier and made it very easy to connect to your website. It is this combination of pricing strategy and a great product that makes Google Analytics ubiquitous to this day, almost 30 years since the original version was created.
It is difficult to overstate the impact that Google Analytics has had in creating the digital apps and services we use today. In short: without the tracking, metrics, and funnels that Google Analytics provides, most of these products would not exist. The way most apps succeed is by identifying a friction point for their users and relentlessly optimizing to remove that friction. This process existed without digital tracking tools, for example, on a factory floor, but the speed, scale, and level of detail enabled by Google Analytics is unprecedented.

If we go back to the New York Times and look at their website and app today, we can see this type of relentless optimization at work. If I want to see what’s going on in the headlines, I can scroll the home page and get a good idea of what’s going on in the world. But as I do, I get a popup trying to convince me to subscribe, including a “sale” that always is in its “final days.”3 I can read one article in its entirety, but if I access a second one, I am again prompted to subscribe or create an account for “free articles.” It turns out it’s only one additional free article before I hit the hard paywall and am again asked to subscribe. The same focus and process that enables manufacturing companies to make physical goods more efficiently has been applied to a different goal: getting me to subscribe to the New York Times.
To be clear, I am a New York Times subscriber, and I have nothing against the Times paywalling their articles or trying to make money. Rather, I want to show how clear it is that the folks responsible for the Times website and app are optimizing it to get subscribers. The way they do this is by using a funnel and getting a baseline conversion number for each step, then testing changes to see what improves the metrics. I am confident there is at least one team of people at the Times whose sole job is to optimize a single number in that funnel or to minimize “customer churn” (the % of customers who cancel their subscription). They have tested different numbers of free articles, different prices, different popup text, and different times of day to send an email. I am also confident that this relentless focus on increasing conversion rates has led to an increased number of subscribers for the Times.
But has it led to a great experience for their readers? Do readers of the Times want popups every time they visit the site? Do people who create accounts to track their Wordle stats want email after email asking them to subscribe? While these tactics do lead to subscribers, it comes at the cost of frustration and annoyance. The focus on metrics that tools like Google Analytics have enabled often ends with the creators of apps ignoring the actual people behind those numbers.
The next time you are using a product, figure out what the creators of that product are optimizing for. Is it to get me to spend time in the product so that I will see ads and buy whatever those ads are selling? Is it to get me to pay for the full version of the product? Is it to get me to take actions that will help me reach a goal? Once you figure it out, you have a decision to make: am I going to do what they want me to do? I encourage you to make that decision quickly, and if that decision involves spending money, then just spend the money now. You have better things to do with your time and attention than to be annoyed or frustrated by ads, popups, and endless emails.
As someone who both uses and creates apps and websites, I urge you to find and pay for products that truly support your goals and stop using the rest. The companies behind products that actually help their users typically avoid the trap of excessive focus on metrics and get to know their customers as people. When companies treat you like a number in a funnel, send them a message in the language they will understand: make their customer churn metric go up.
BuiltWith.com data for Google Analytics, using the top 100k sites metric
The story and history of Google Analytics/Urchin is drawn from this post by one of the founders, Scott Crosby.
If you do decide to subscribe to the Times, please never pay more than $4 per month, that is the true price.